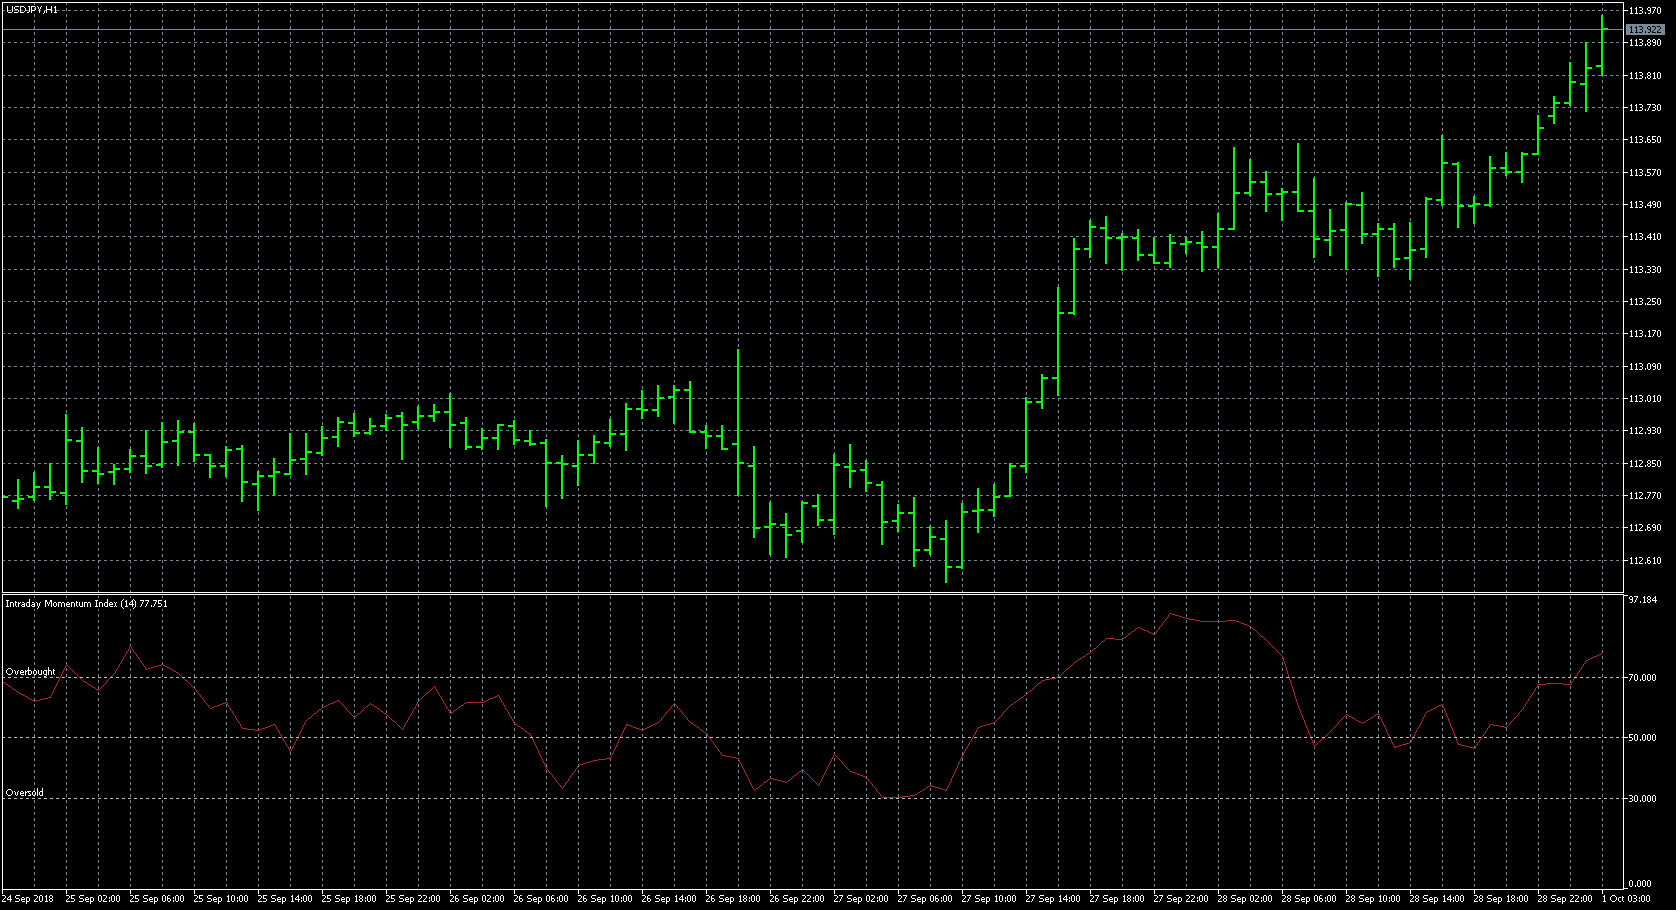
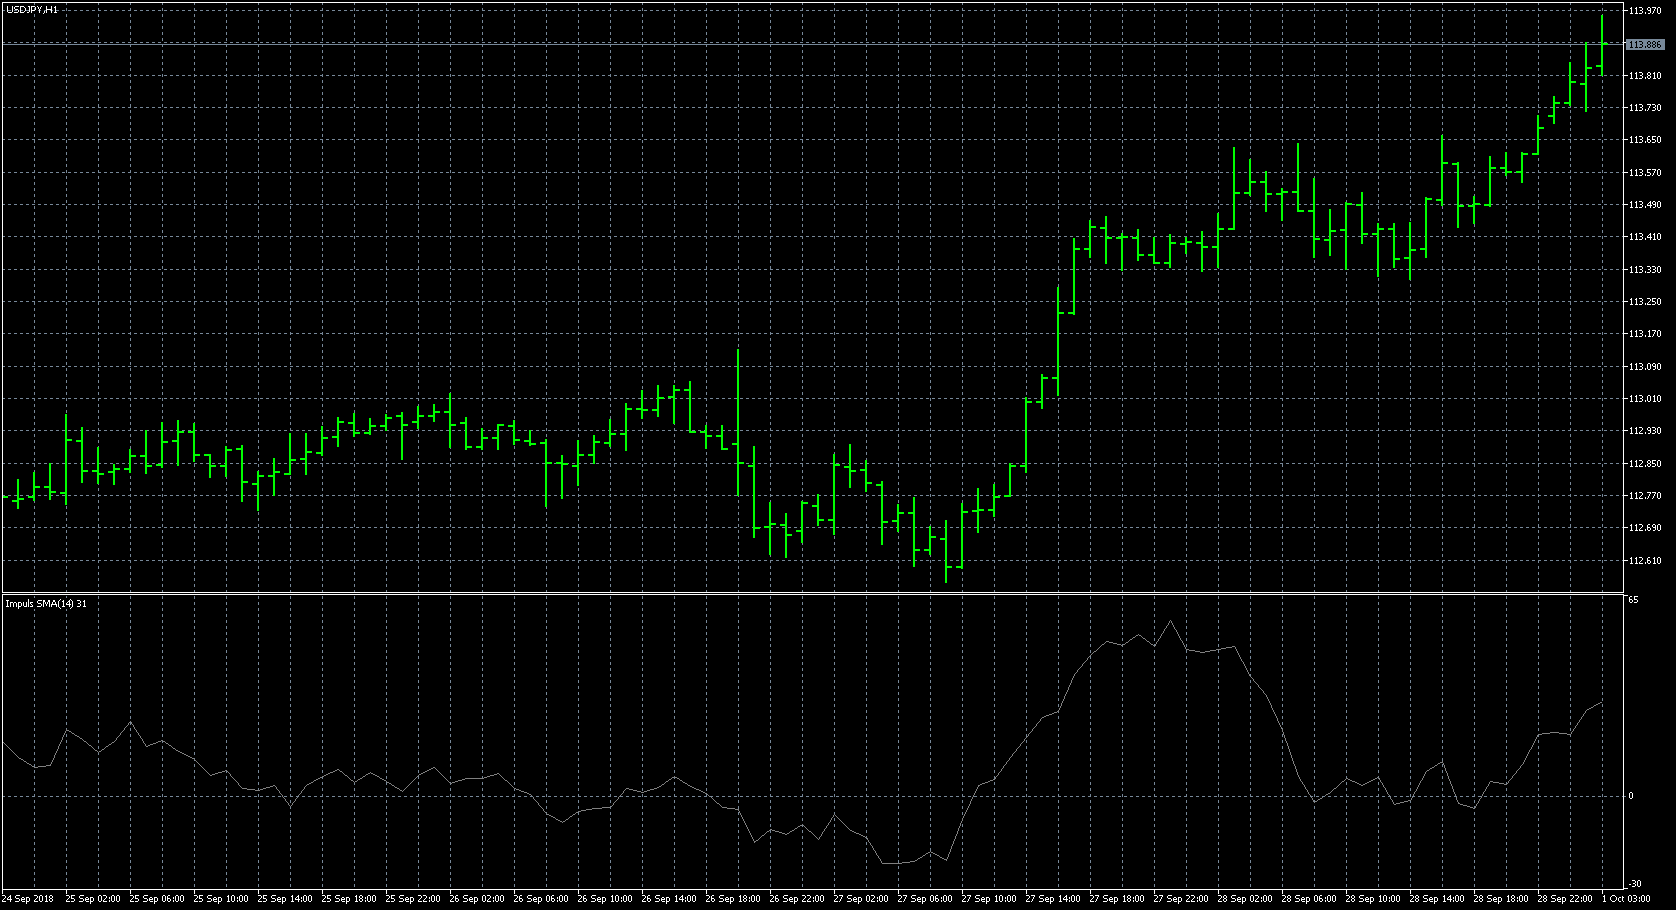
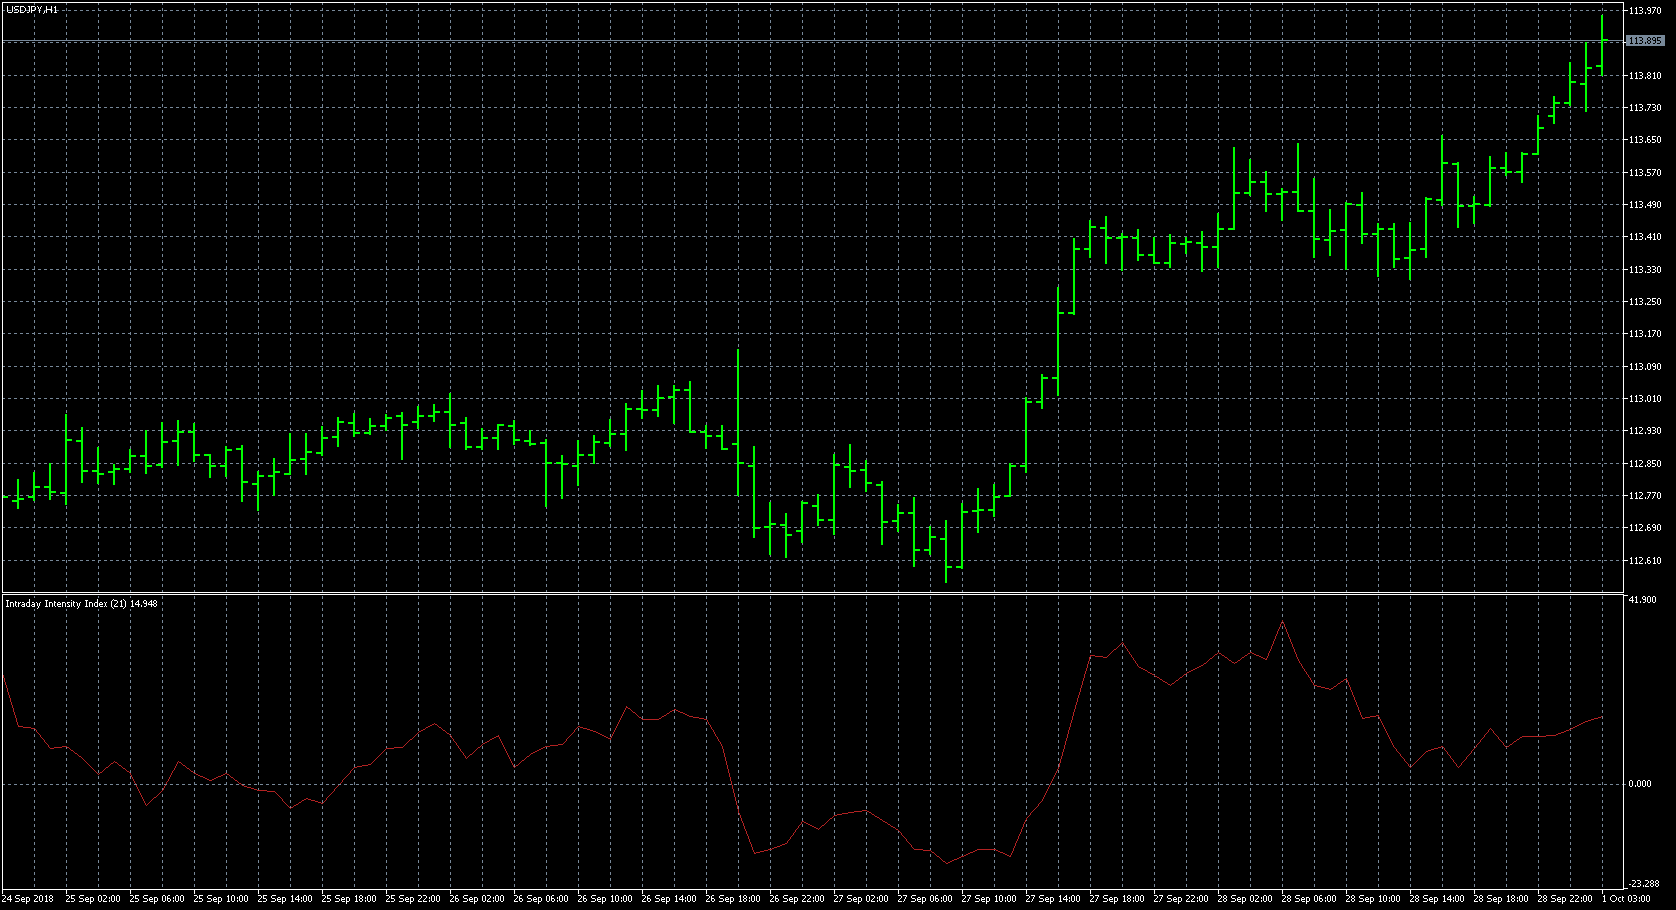
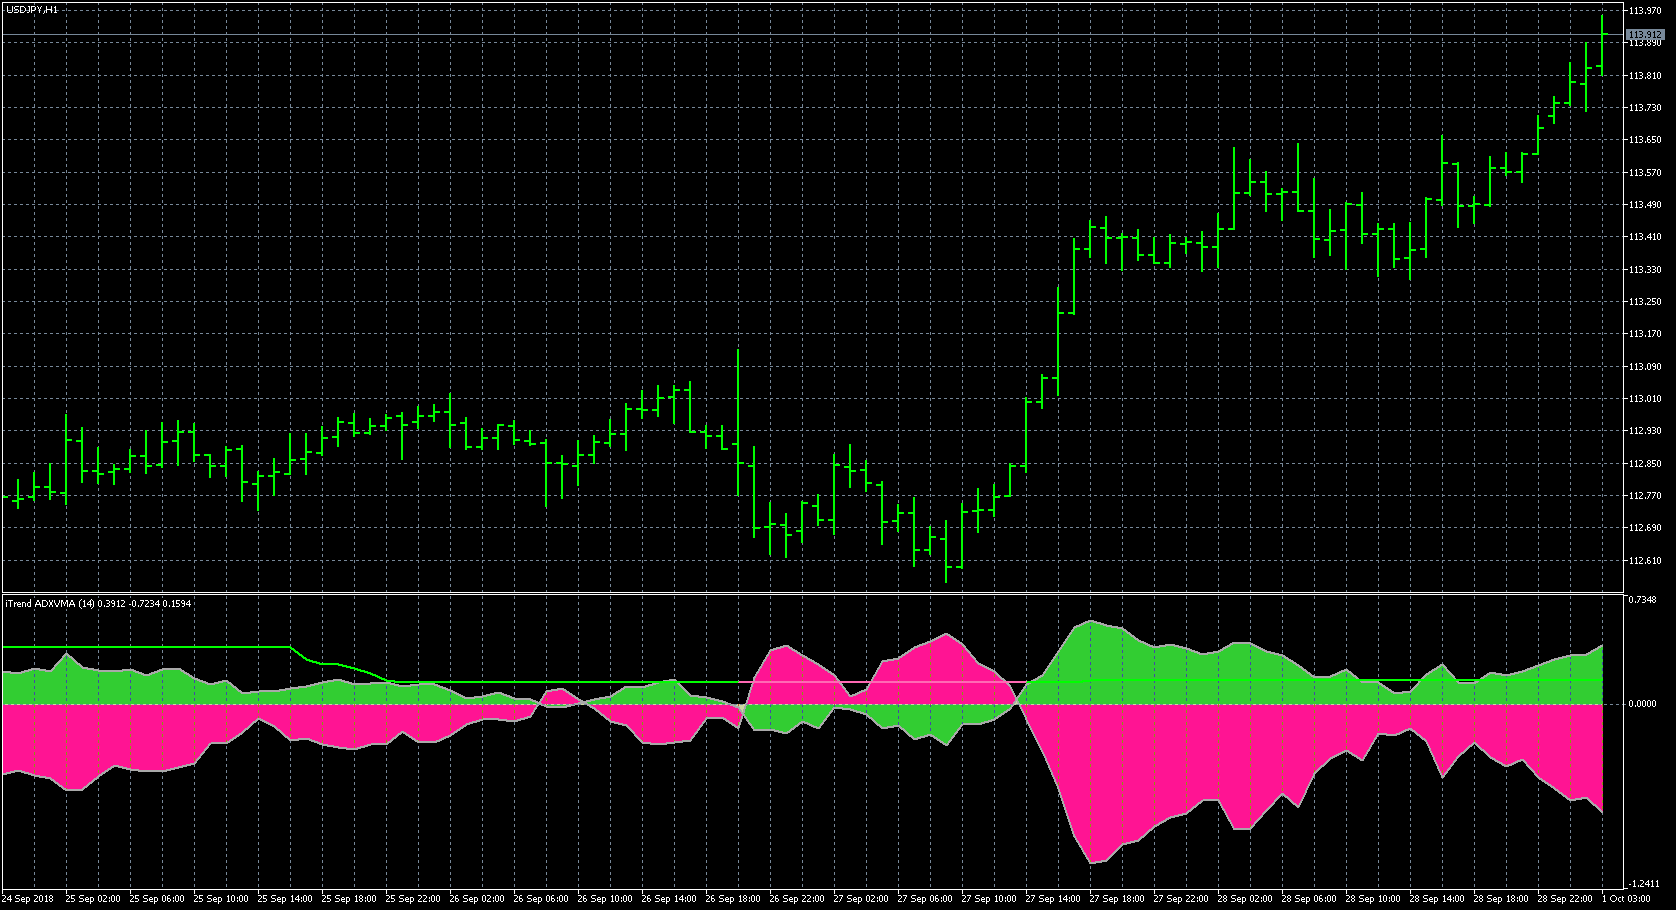
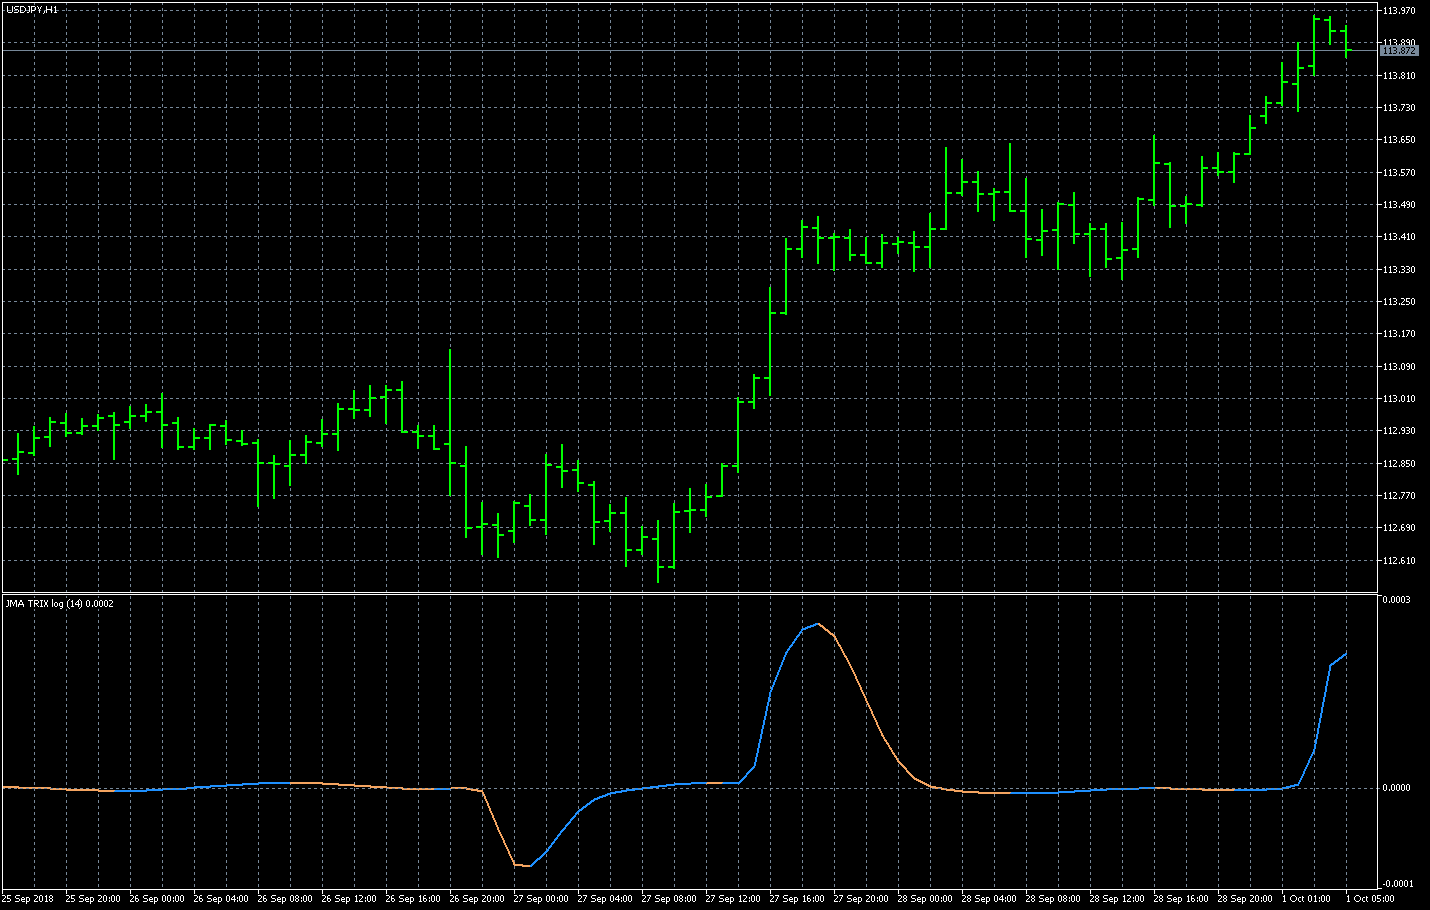
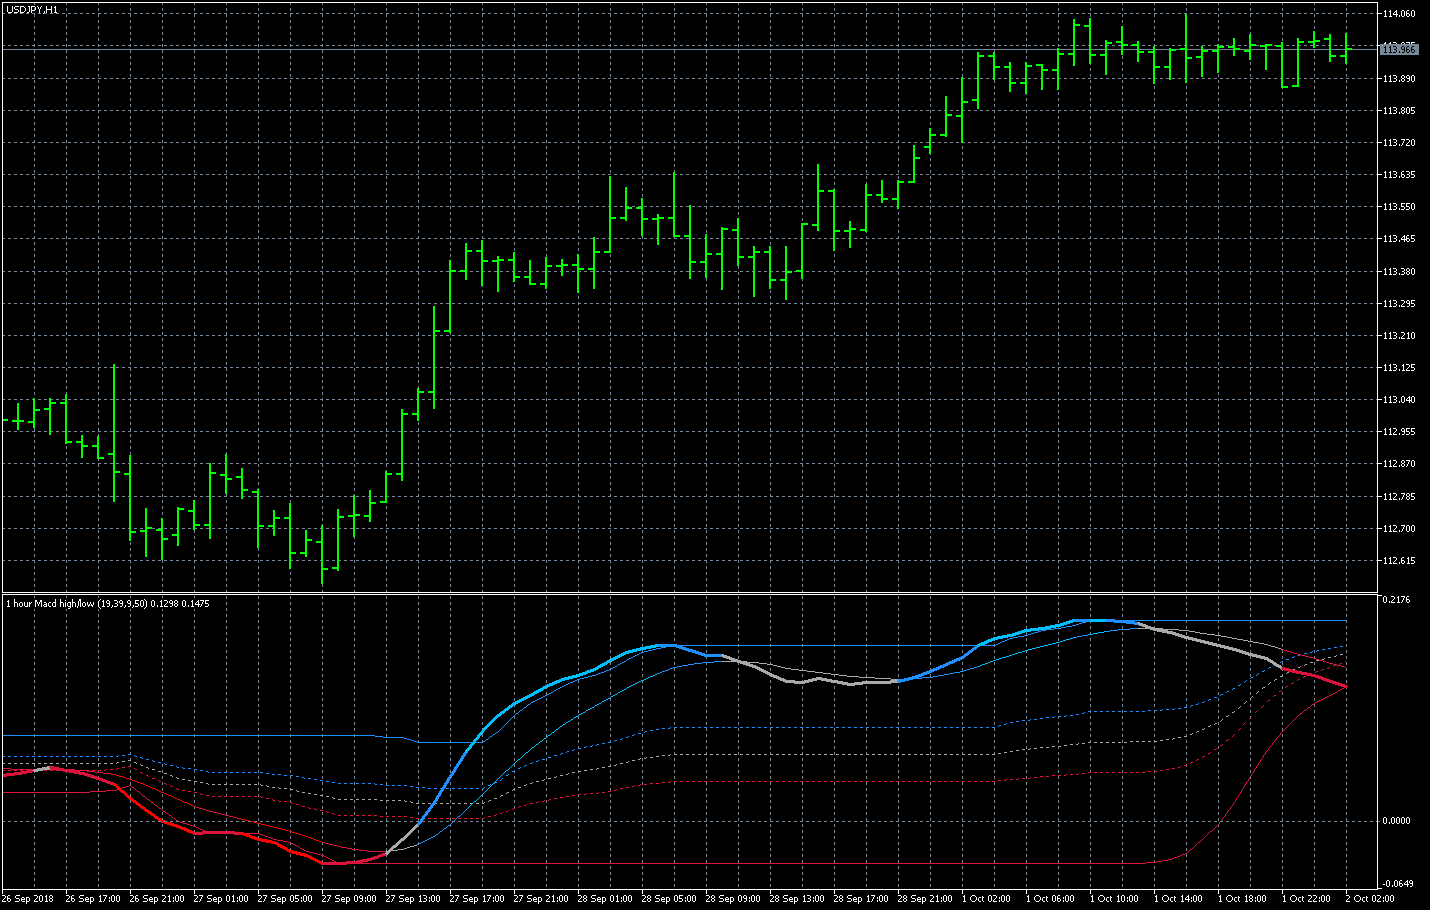
FXのフリーのチャートソフト、メタトレーダー5 (MT5)にインディケーターを表示させた画像です。
画像をクリックすると大きく表示されます。

画像下のインディケーター名をクリックするとインディケーターがダウンロードできます。

うまくインディケーターをダウンロードできない方は、
インディケーター名の上で[マウスを右クリック]→[対象をファイルに保存]を選んで保存して下さい。

ライン・連続したドット-19

| 01 | 02 | 03 | 04 | 05 | 06 | 07 | 08 | 09 | 10 | 11 | 12 | 13 | 14 | 15 | 16 | 17 | 18 | 19 | 20 |

| 21 | 22 | 23 | 24 | 25 | 26 | 27 | 28 | 29 | 30 | 31 | 32 | 33 | 34 | 35 |

Heiken Ashi Smoothed - binaryの表示画像

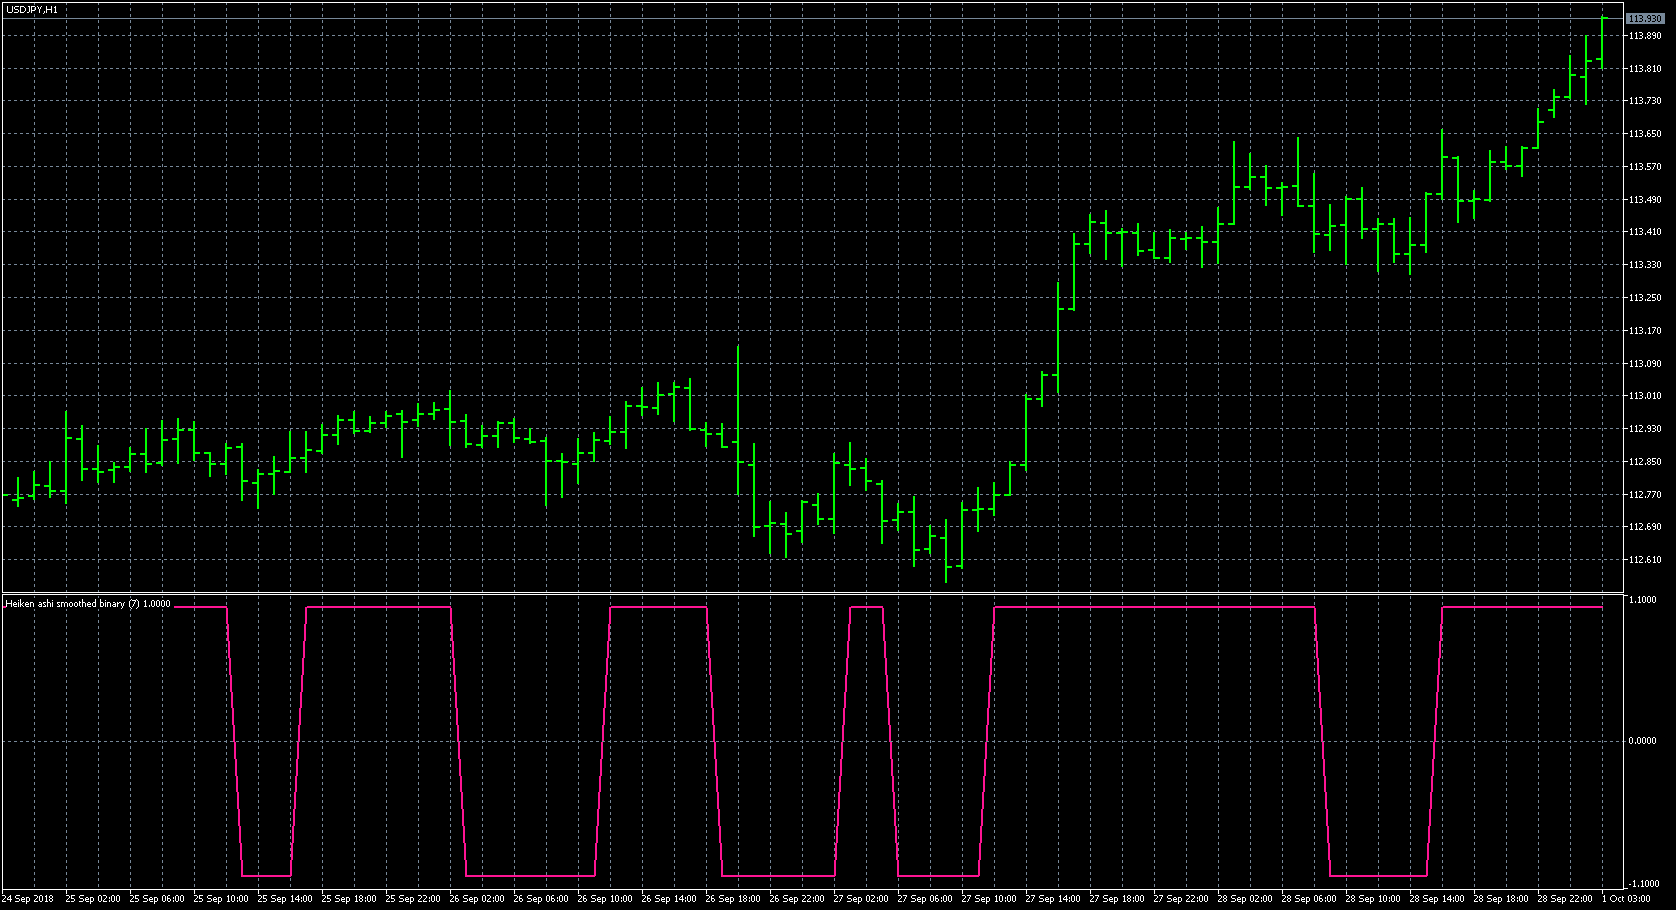
Heiken Ashi Smoothed - binary.mq5

Historical volatility - high-lowの表示画像

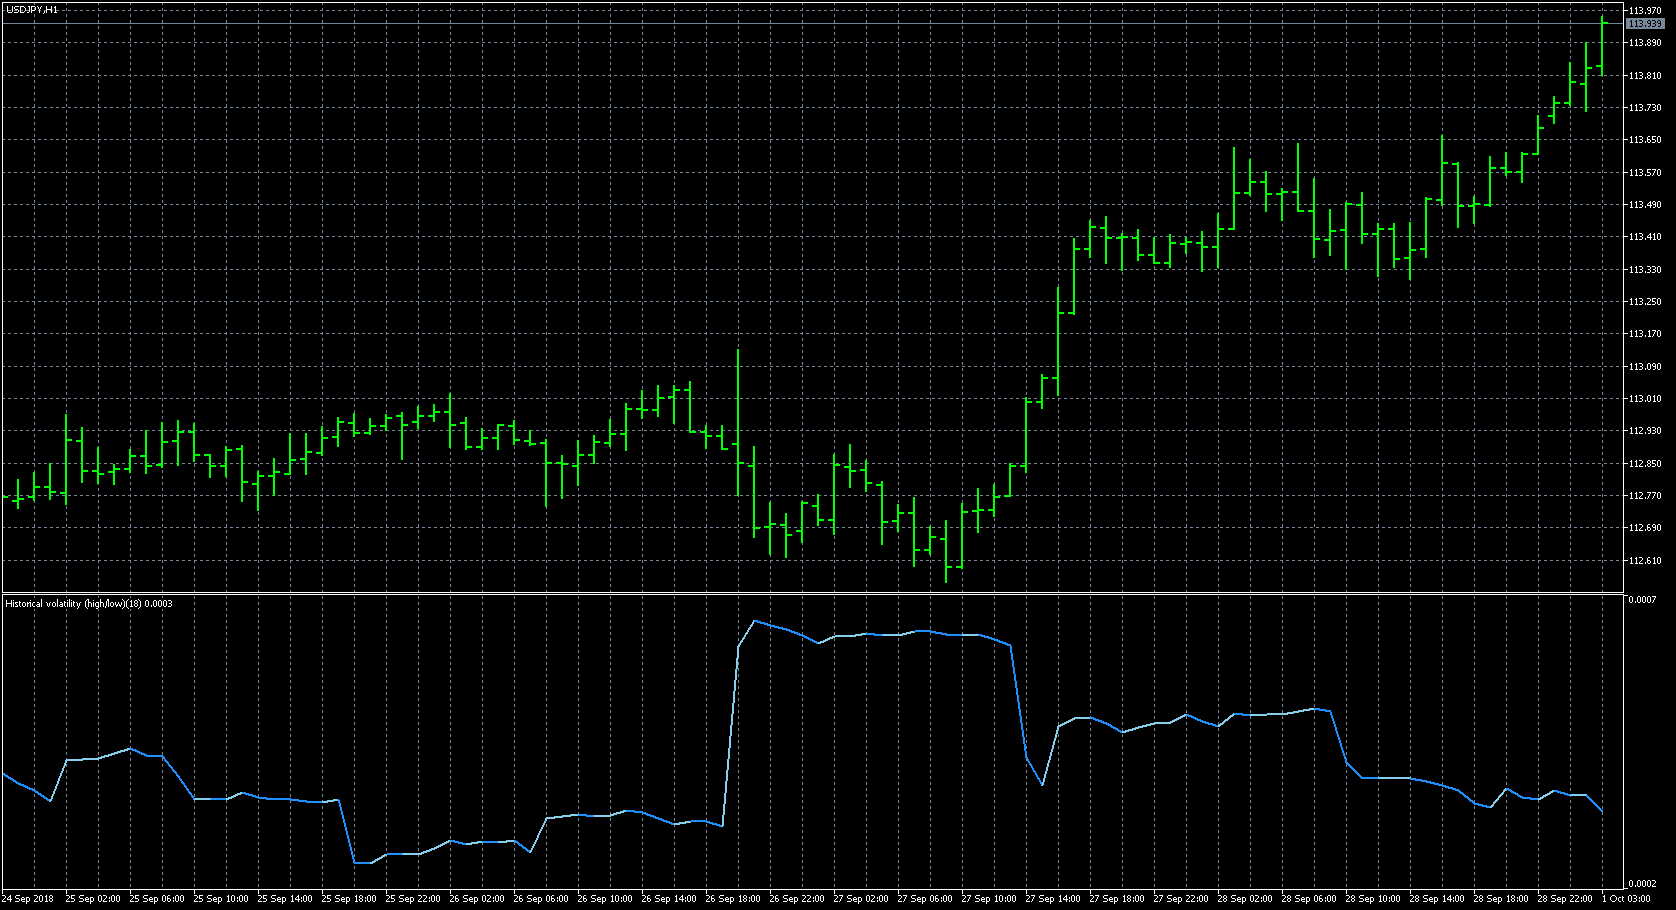
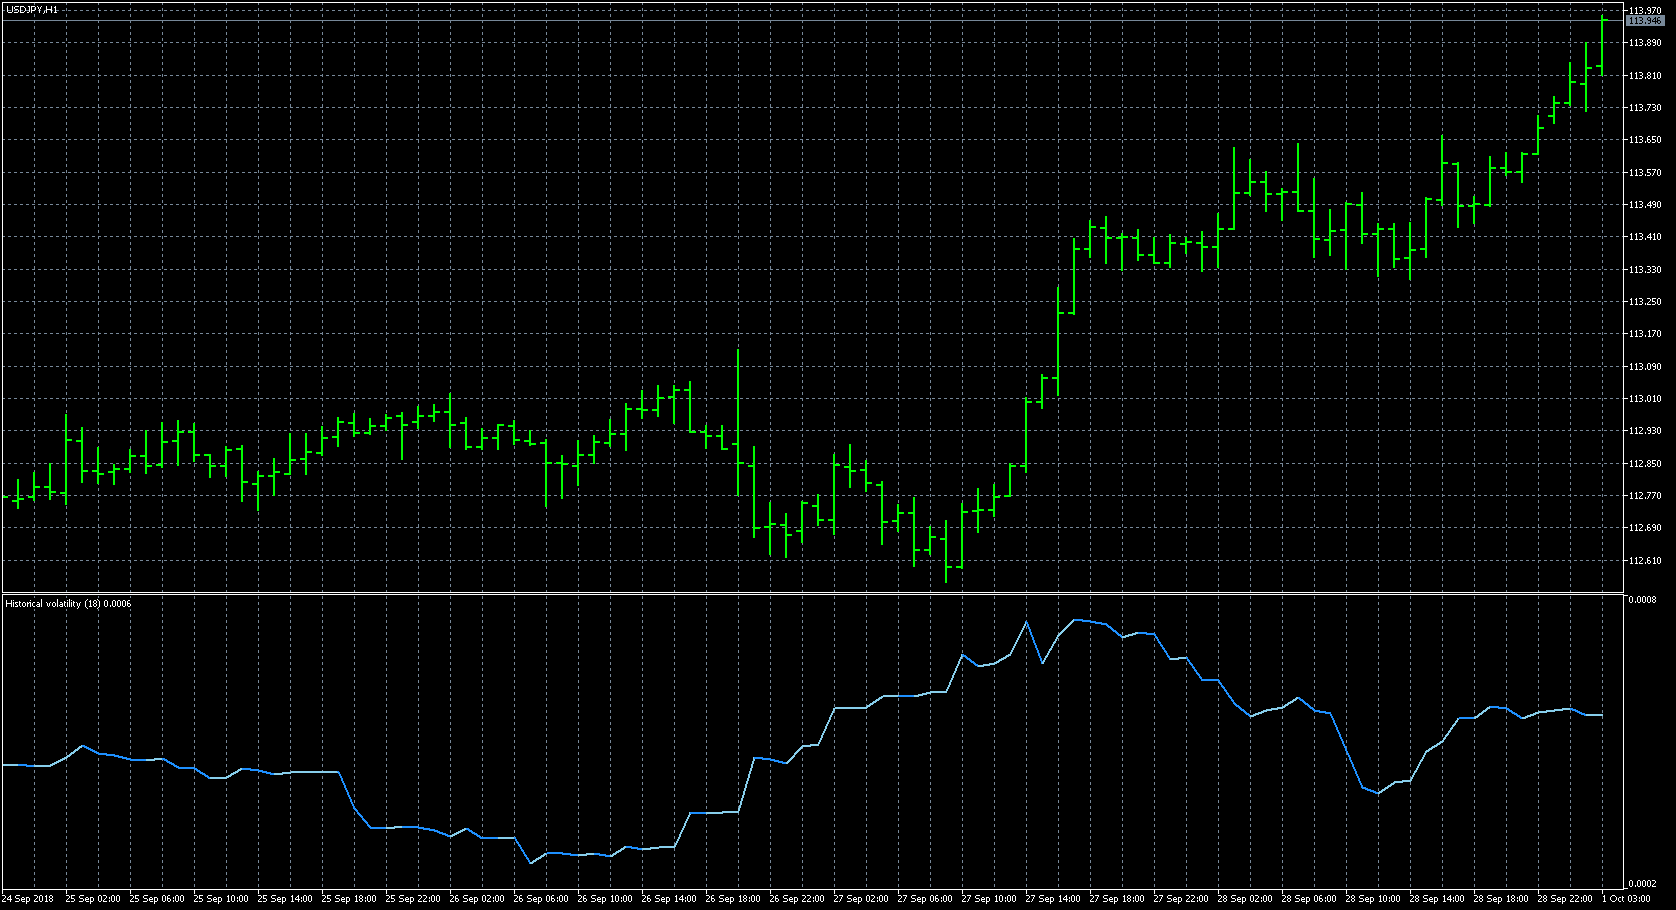
Historical volatility - high-low.mq5

Historical volatility - Parkinsonの表示画像

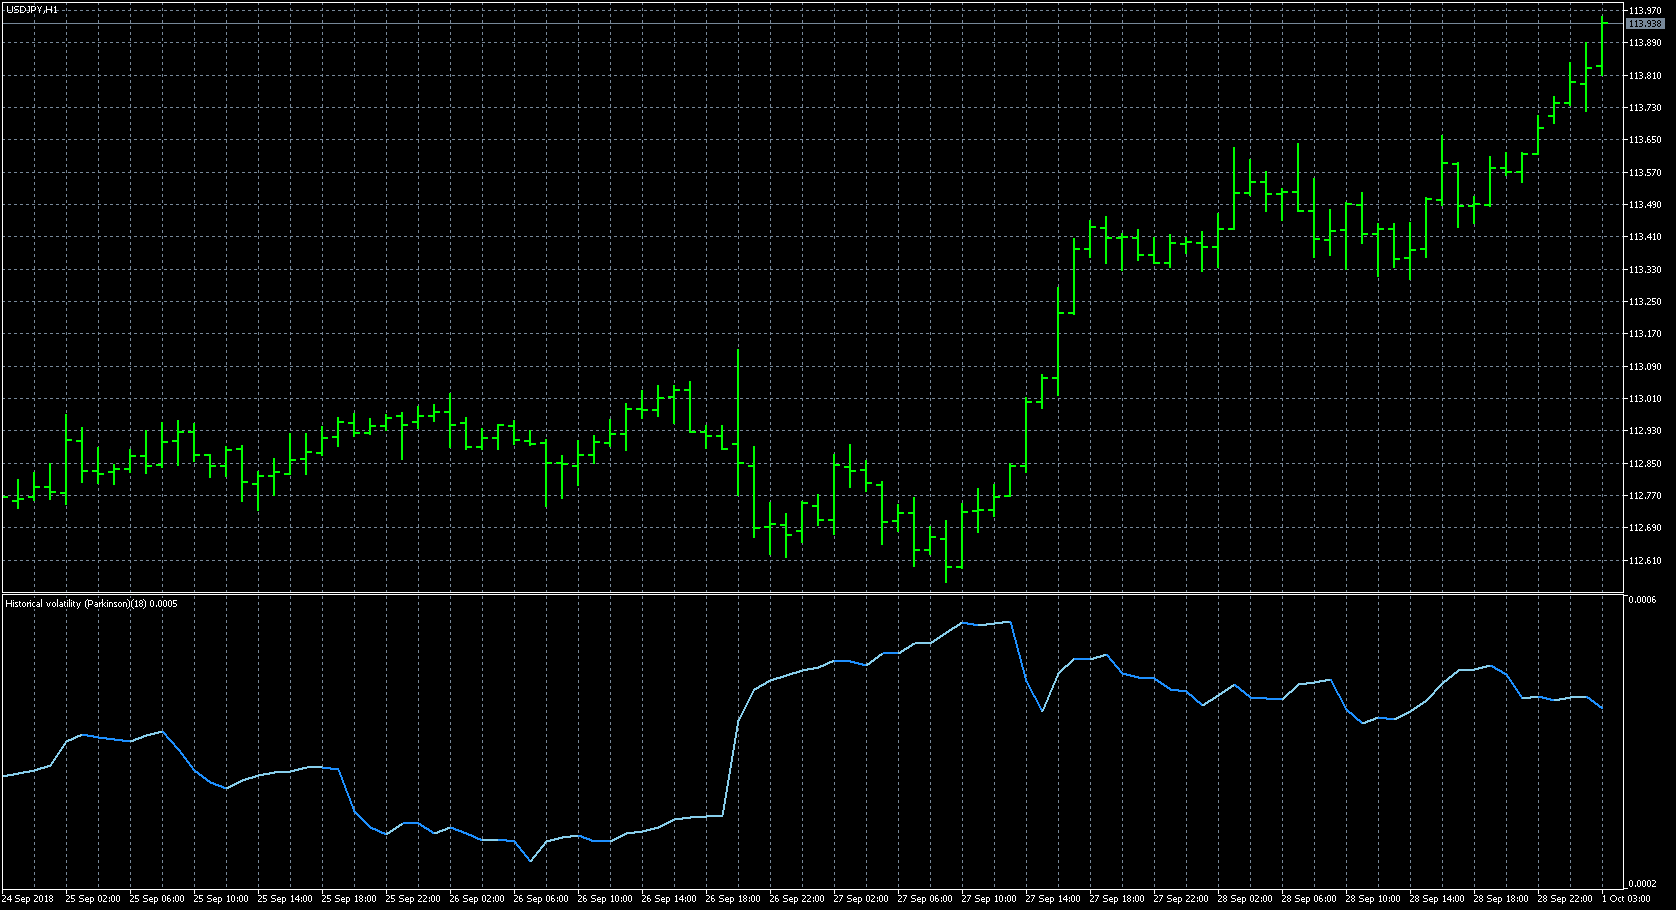
Historical volatility - Parkinson.mq5

Historical volatilityの表示画像

Historical volatility.mq5

HL_StdDevの表示画像

HL_StdDev.mq5

HVRの表示画像

HVR.mq5

IMIの表示画像

IMI.mq5

Impulseの表示画像

Impulse.mq5

Intraday_Intensity_Indexの表示画像

Intraday_Intensity_Index.mq5

iTrend ADXVMAの表示画像

iTrend ADXVMA.mq5

iTrend JMAの表示画像

iTrend JMA.mq5

JMA TRIX logの表示画像

JMA TRIX log.mq5

JMA z-scoreの表示画像

JMA z-score.mq5

Jurik volty mtfの表示画像

Jurik volty mtf.mq5

Jurik voltyの表示画像

Jurik volty.mq5

KDJ_Averagesの表示画像

KDJ_Averages.mq5

KDJの表示画像

KDJ.mq5

Klinger_Oscillatorの表示画像

Klinger_Oscillator.mq5

Laguerre RSI with Laguerre filter extendedの表示画像

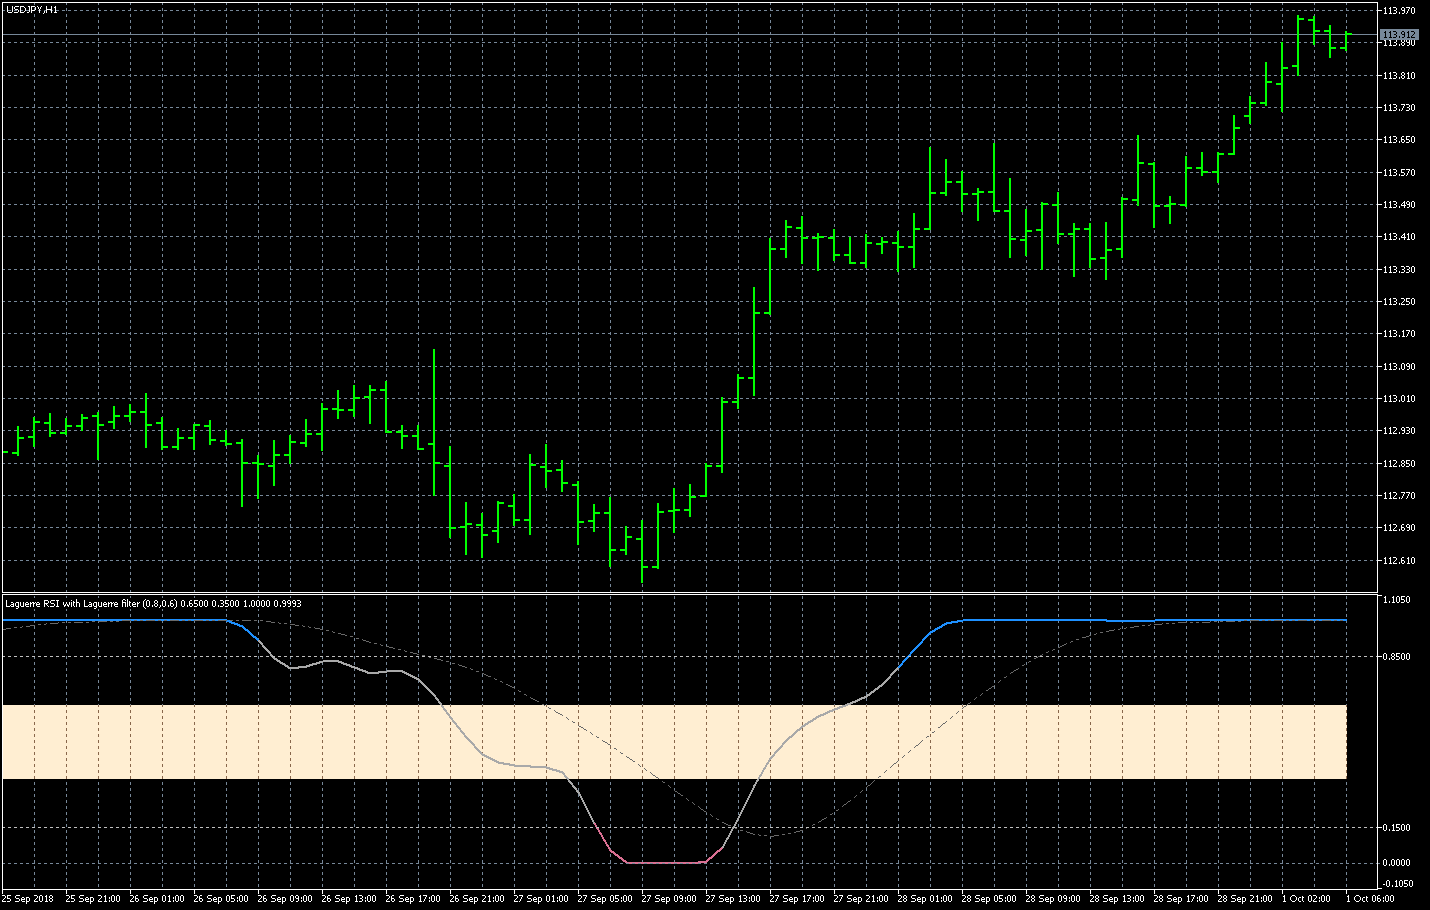
Laguerre RSI with Laguerre filter extended.mq5

Leader of MACDの表示画像

Leader of MACD.mq5

Logarithmic Garman Klass Volatilityの表示画像

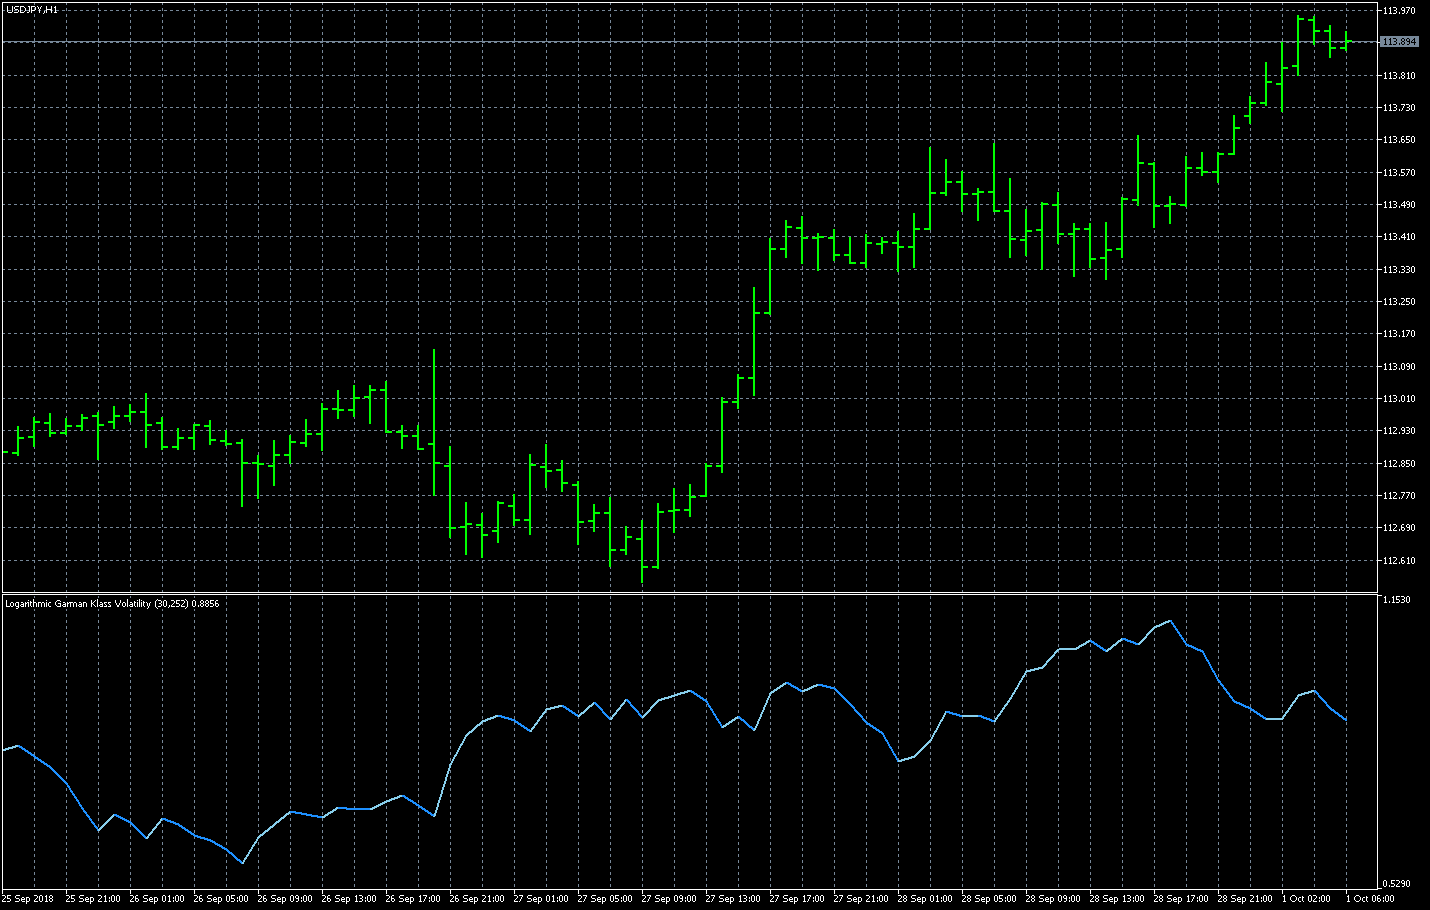
Logarithmic Garman Klass Volatility.mq5

LSMA trendの表示画像

LSMA trend.mq5

LWPIの表示画像

LWPI.mq5

LWTIの表示画像

LWTI.mq5

Lyapunov_HPの表示画像

Lyapunov_HP.mq5

Macd hl mtfの表示画像

Macd hl mtf.mq5

MACD of deviation scaled MAの表示画像

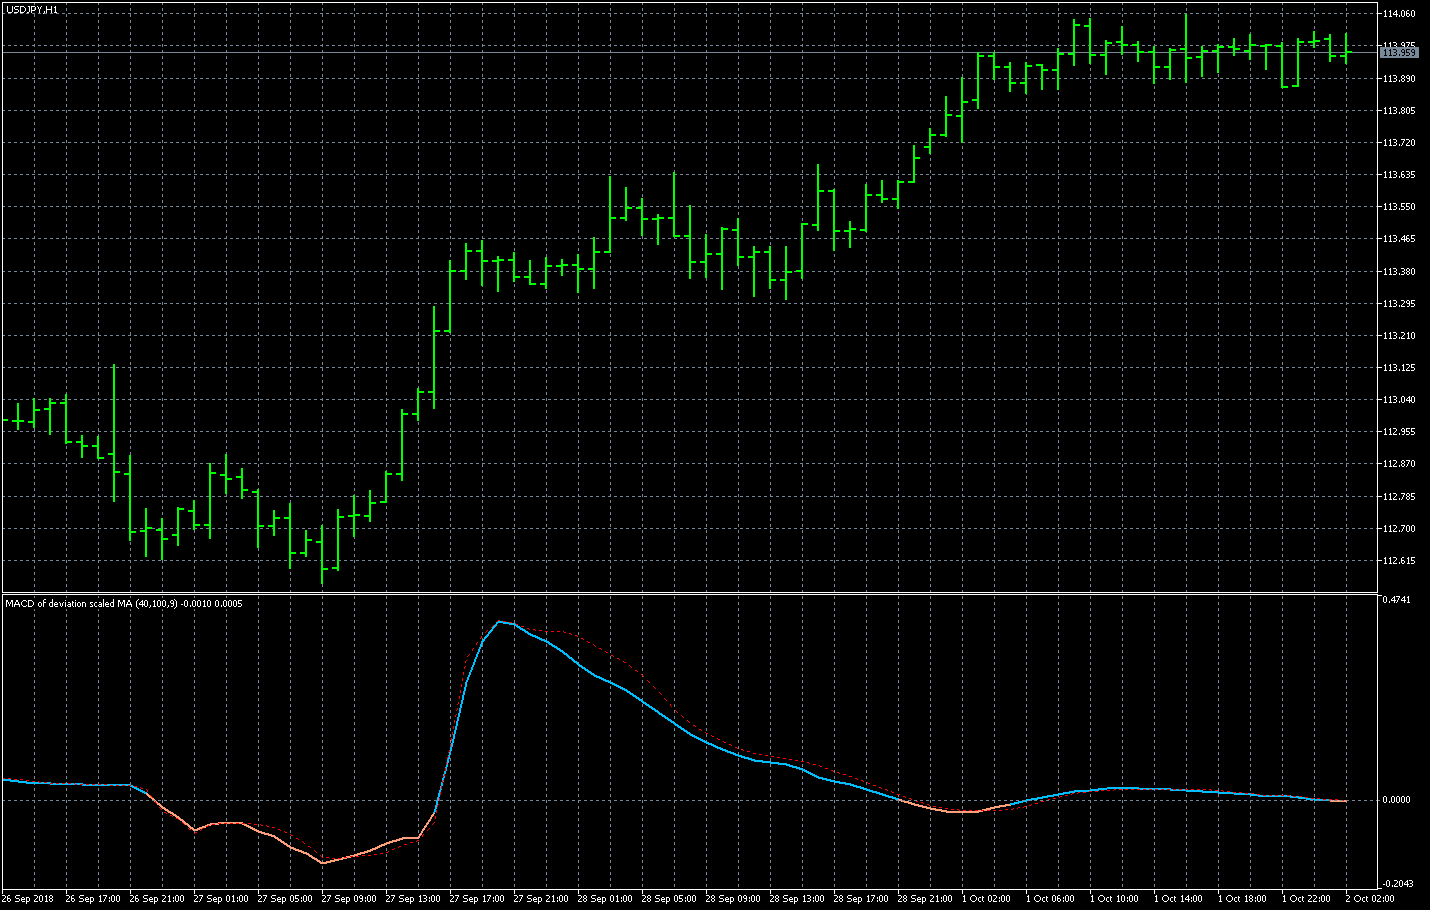
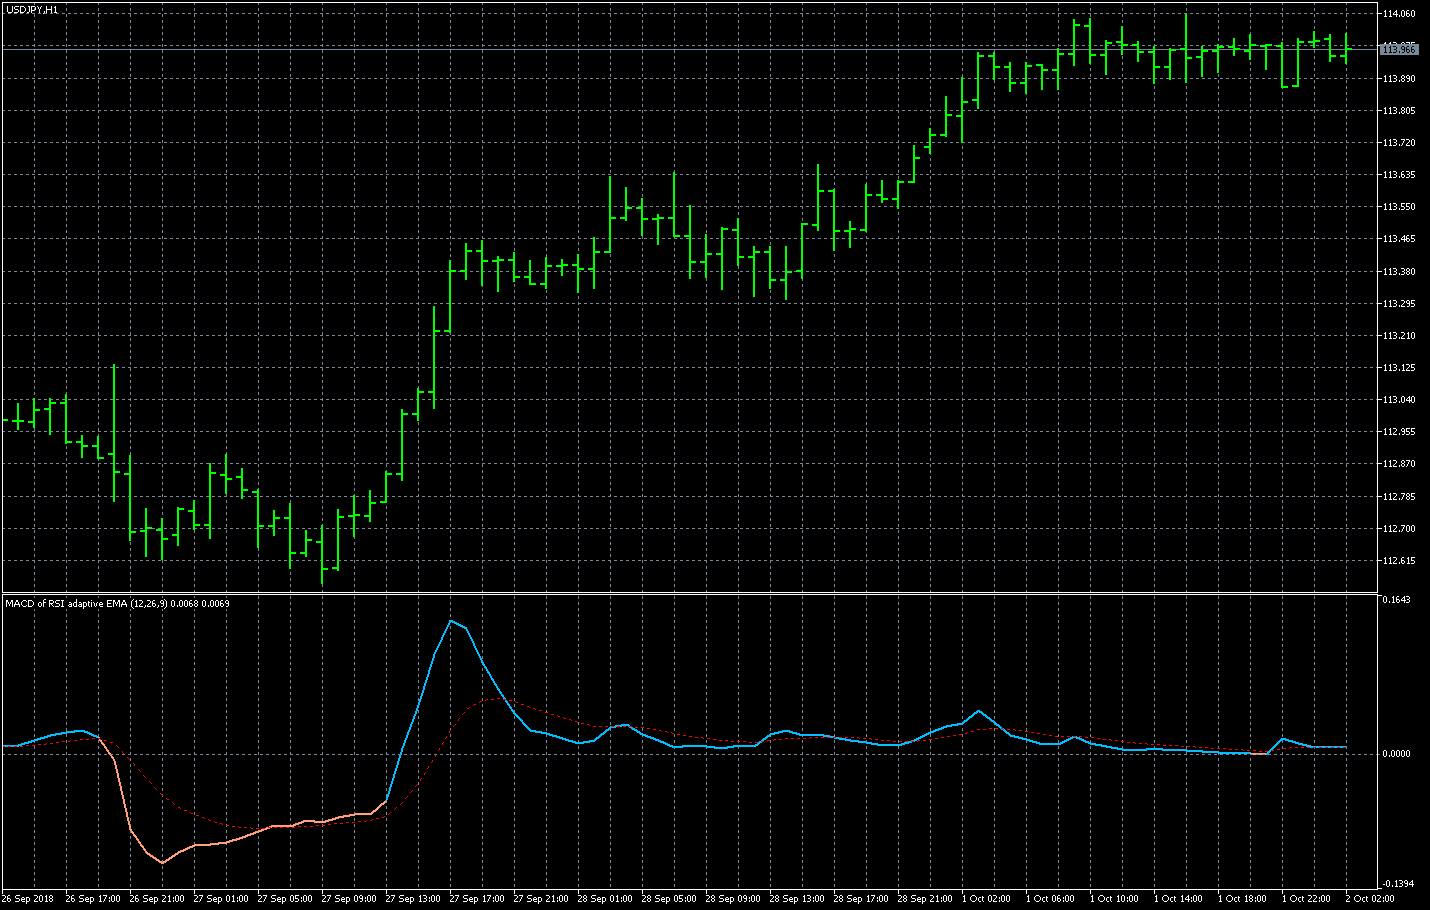
MACD of deviation scaled MA.mq5

MACD of RSI adaptive EMAの表示画像

MACD of RSI adaptive EMA.mq5

MAEの表示画像

MAE.mq5

MA_Differenceの表示画像

MA_Difference.mq5


| 01 | 02 | 03 | 04 | 05 | 06 | 07 | 08 | 09 | 10 | 11 | 12 | 13 | 14 | 15 | 16 | 17 | 18 | 19 | 20 |

| 21 | 22 | 23 | 24 | 25 | 26 | 27 | 28 | 29 | 30 | 31 | 32 | 33 | 34 | 35 |